Using the Community Indicators Library to Drive Community Change
We are often called upon to use various kinds of data in community change work for different circumstances—to assess community conditions, monitor trends, prioritize areas for investment, and more. Grounding community action in data is important because it helps us move beyond assumptions, anecdotes, or one-time observations to a clearer understanding of what is actually happening on the ground. Data allow us to identify patterns and inequities that might otherwise go unnoticed, highlight the voices and needs of populations who are often overlooked, and measure whether efforts are making a meaningful difference. By using evidence to inform strategies, communities can allocate resources more effectively, design interventions that address root causes rather than symptoms, and adapt quickly when conditions shift.
Access to data is often described as easier than ever, with vast amounts publicly available online. Yet, in practice, meaningful access is becoming more complicated. Recent reductions in the availability of federal datasets and varying levels of transparency across sources make the process far from straightforward.
Navigating this evolving landscape can be difficult, particularly when it comes to:
- Determining where reliable and up-to-date data can be found
- Identifying the right indicators to address specific questions
- Assessing the quality, completeness, and comparability of available datasets
The Community Indicator Library is a living library of data indicators, or metrics, that changemakers use to measure health, well-being, and equity in their communities. It’s designed to help users find indicators relevant to their community change work, identify reputable datasets and sources, and explore related topics on Community Commons. It contains many indicators commonly used in community health practice from sources that make data available nationwide at the county- or Census-tract level, such as the American Community Survey, PLACES, Food Access Research Atlas, and others.
The library makes many data indicators freely available for all U.S. counties. By providing open access to trusted, nationally consistent data, we help communities of all sizes to ground work in evidence. These indicators span health, equity, economic well-being, and the environment.
How to Use the Community Indicators Library
Categorization of Indicators in the Library
Indicators are categorized into the below thematic areas. Use these categories to explore indicators in this library, or search by topic.- Demographic
- Well-Being Outcomes
- Health Behaviors
- Clinical Care and Urgent Services
- Social and Economic Factors
- Physical Environment
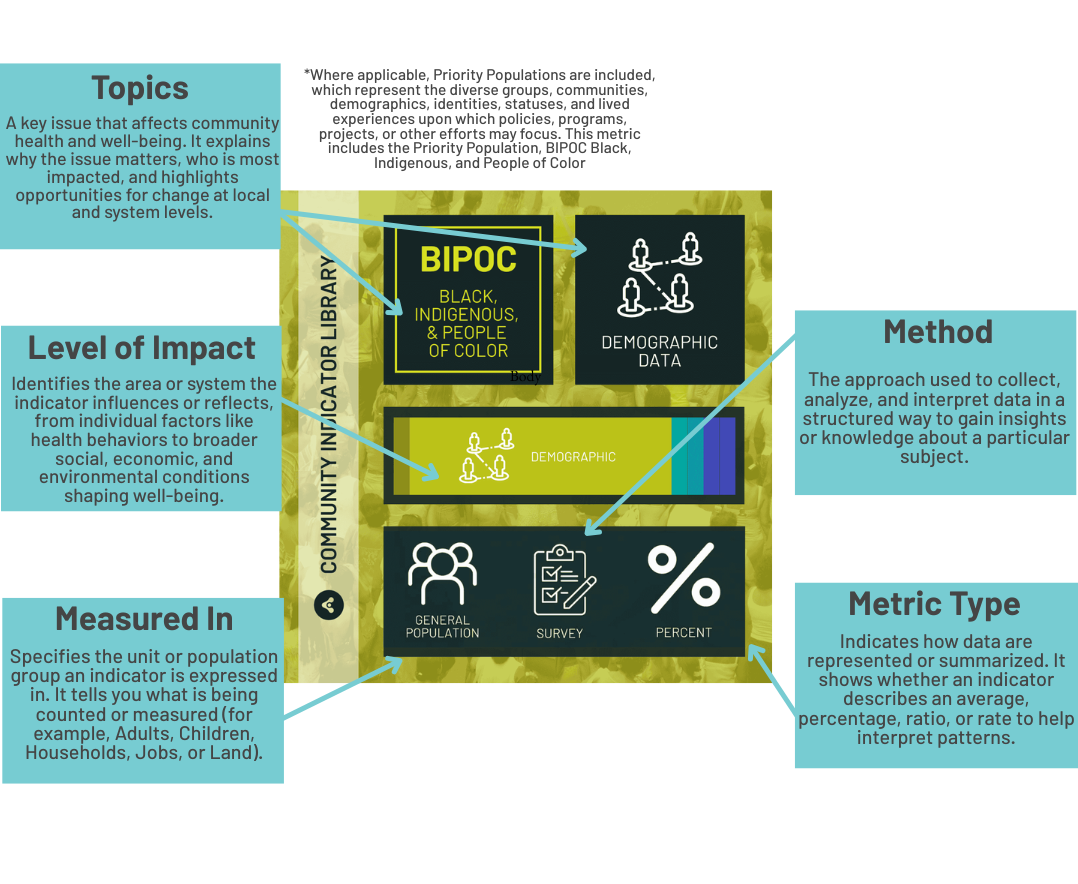
Each indicator includes additional details—like what level it measures (for example, people, households, or neighborhoods), how it’s calculated, and what kind of data it represents. The indicator graphic shows all of this information in an easy-to-read format.
Interpreting the Graphic
Throughout the site, metric graphics like the one below are used to summarize the contents, focus, and results of each metric. Explore below for insight into each element of a metric.
Access Local Data for Some Indicators
Some indicators in the Community Indicators Library included embedded IP3 ASSESS Dashboards, which allow you to interact with data directly from the library. Users can select their county of interest to see local data, compare it to state and national benchmarks, and identify areas that are working well or may need more support. All dashboards featured in the library are part of a curated collection of featured indicators, ensuring users can quickly find measures.
Get More Information
Once on the page for a specific data indicator in the library, scroll down to the Data and Metrics section to view the source dataset. From there, you can click through to the dataset page for more details about how the data was collected, its definitions, and additional community-level breakdowns.
Each indicator page also connects you to related content, including:
- Related Topics – broader themes that help frame the indicator within areas like health, equity, or the environment.
- Resources and Tools – research reports, journal articles, and guides that provide deeper insights and practical applications of the data.
- Stories – real-world examples of how communities are addressing the issue highlighted by the indicator.
The selection of indicators available will grow over time—be sure to check back for updates. You can also access featured indicators (with local data!) by subscribing to the In Common Newsletter. By returning regularly, you’ll not only find new measures but also learn about evolving best practices in how data can be applied to support community well-being.
The Community Indicators Library was built to take the guesswork out of finding, interpreting, and using reliable administrative data. By providing free access to trusted, nationally sourced indicators for every county in the U.S., the library helps level the playing field for communities with fewer resources. Whether you are assessing health disparities, exploring economic challenges, or examining social and environmental conditions, the library makes it easier to ground your work in evidence and focus energy on solutions.

 Original
